Insights Set Up Guide
Overview
This guide provides step-by-step instructions for integrating Specmatic Insights into your API ecosystem. It is intended for developers and testers adopting contract-driven development and looking to visualize and monitor their microservices architecture. This guide will help you set up, configure, and troubleshoot Specmatic Insights.
Introduction
Specmatic Insights is a powerful tool that aggregates Specmatic reports from various environments such as your CI/CD pipelines and visualizes how your organization's microservices, microfrontends & clients interact with each other. This guide will walk you through the setup process and help you leverage the full potential of Specmatic Insights.
Features
Specmatic Insights offers several key features:
- View your service dependency graph in real-time as your CI builds run
- Track CDD (Contract-Driven Development) adoption progress in your organization
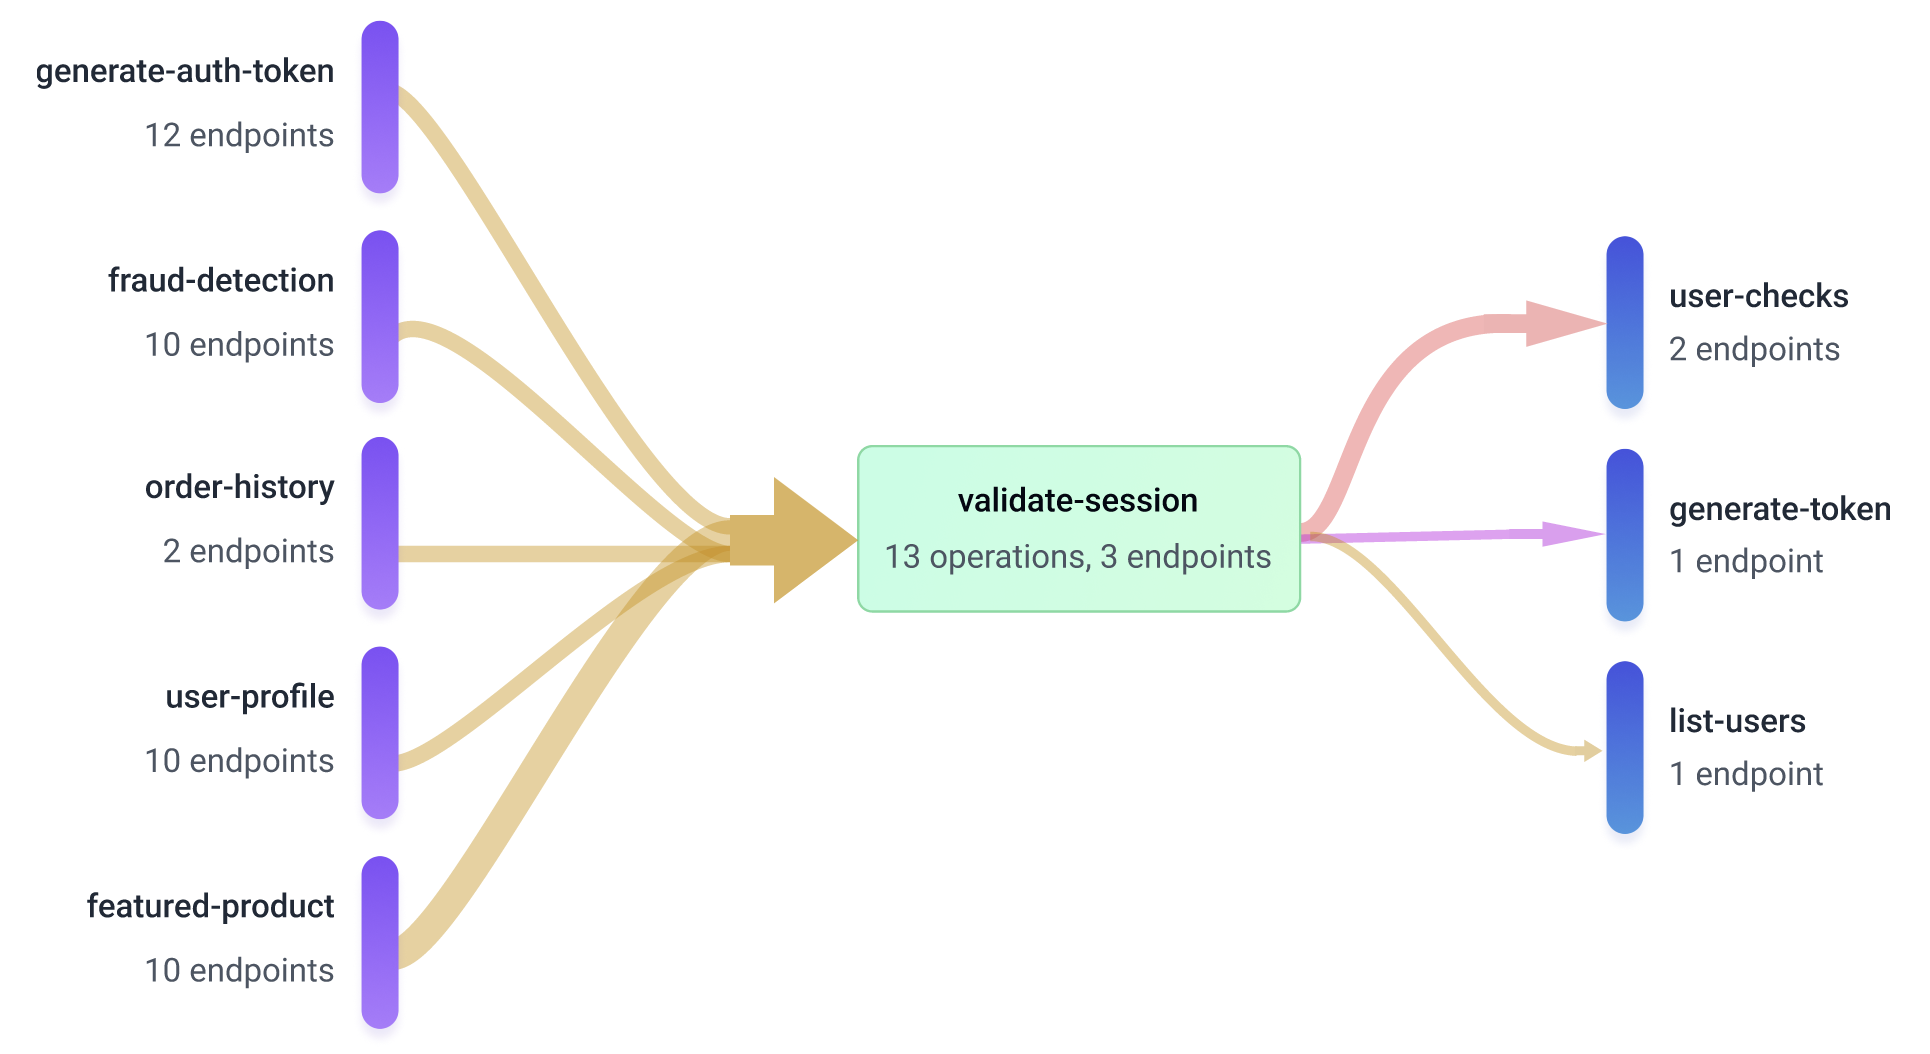
- Identify dependencies between services
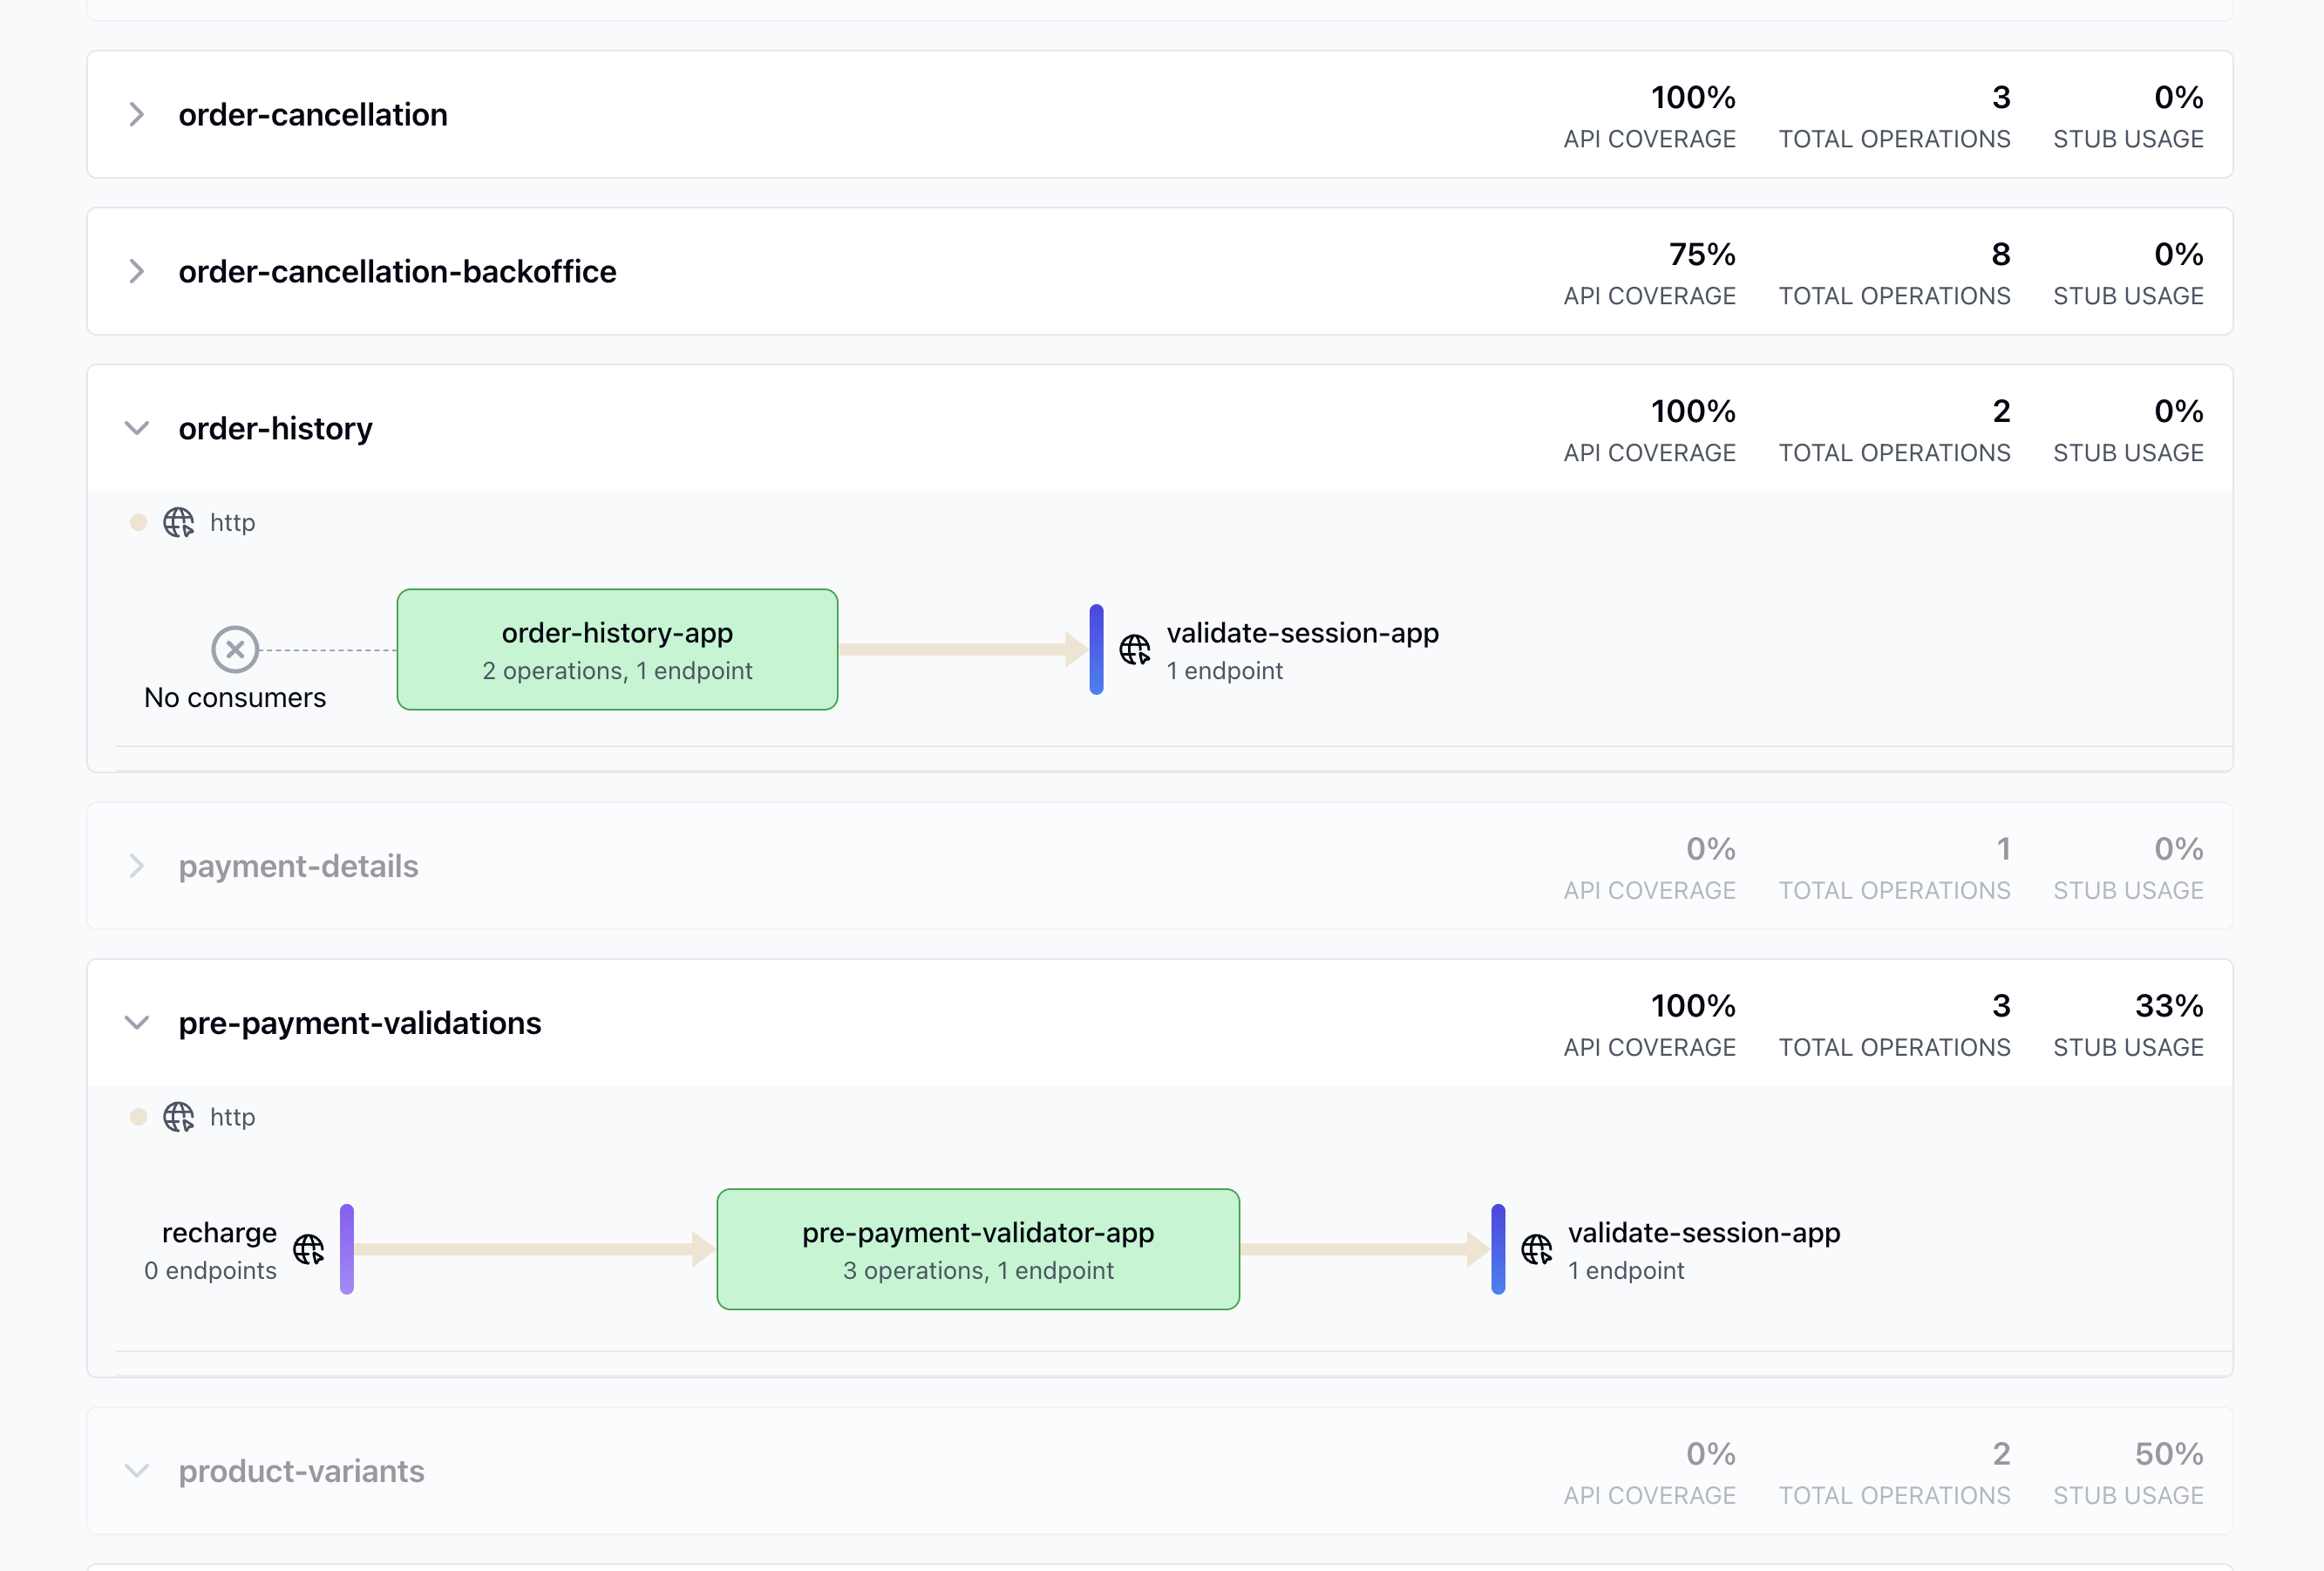
- Monitor API coverage and stub usage of your services
Here are some examples of what you can expect to see in Specmatic Insights:
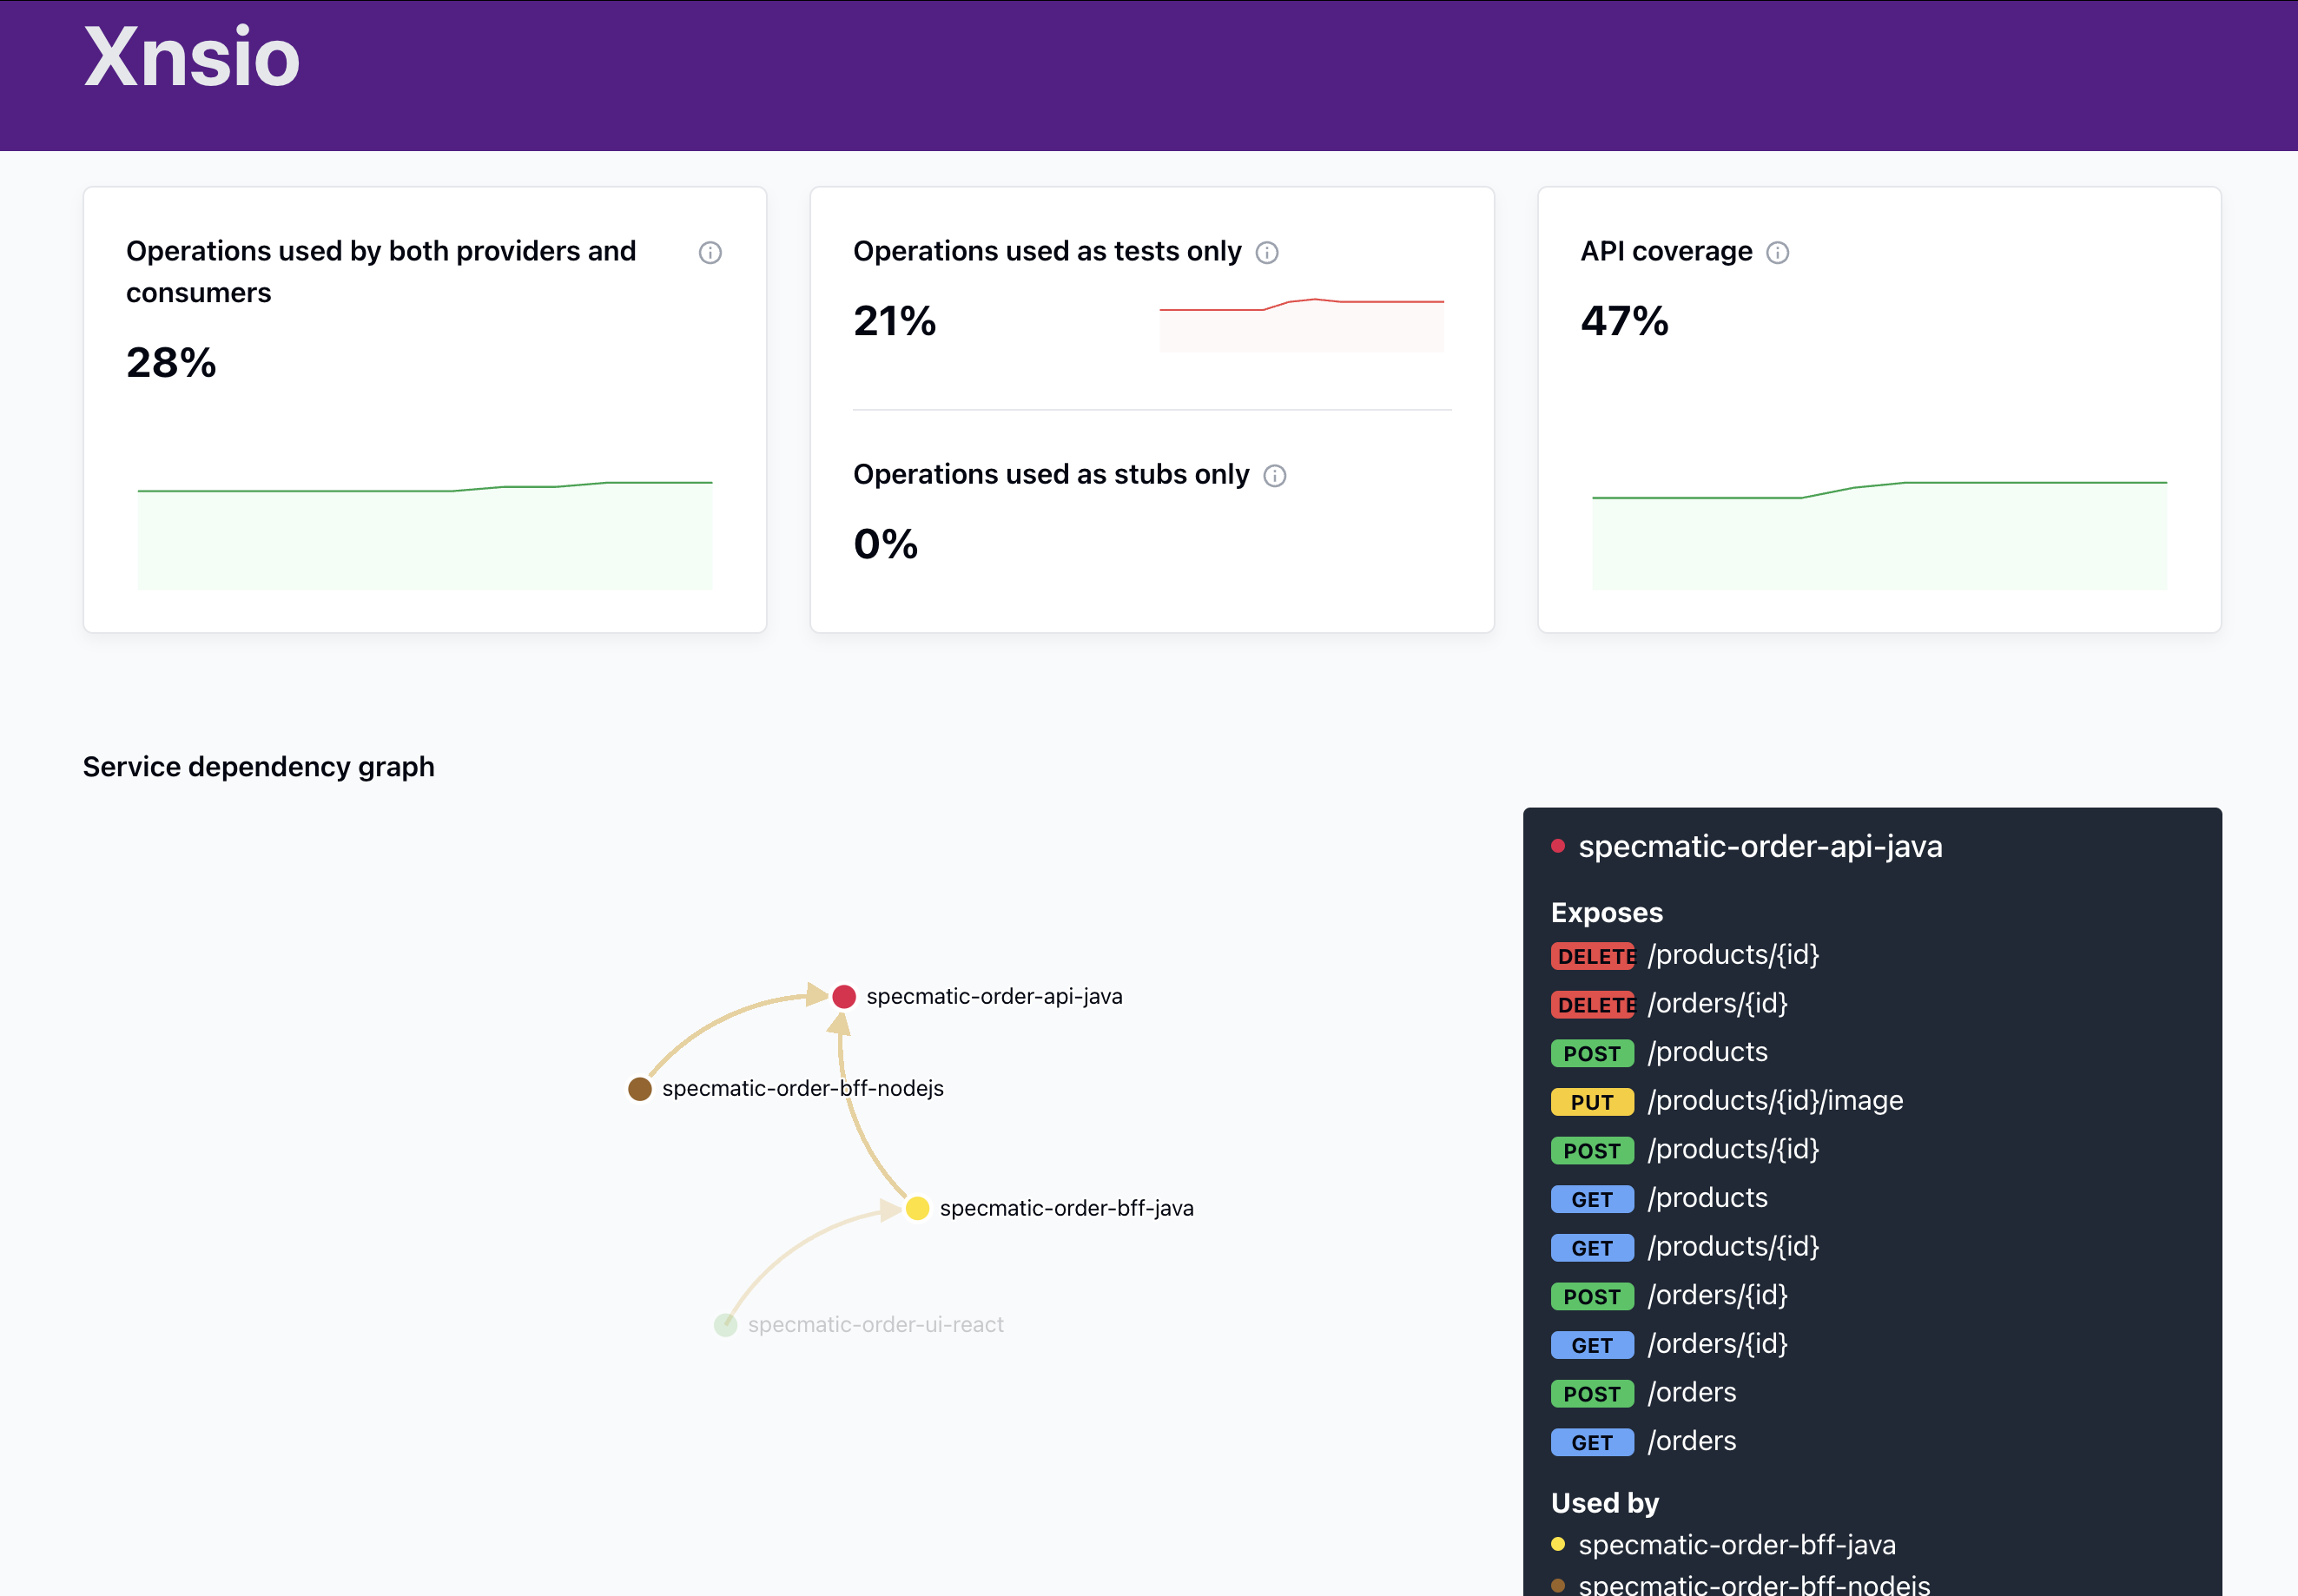
Additionally, the dashboard provides a comprehensive overview of your API ecosystem, offering valuable insights such as:
- Identify circular dependencies in your service architecture
- Pinpoint single points of failure or congestion points in your architecture
- The proportion of operations used by both providers and consumers
- Operations used exclusively for testing and stubbing
- Overall API coverage
Prerequisites
Note: To publish builds to Specmatic Insights, you must have a valid license key issued by Specmatic. Please ensure you have obtained your license before proceeding with the setup.
For details on acquiring and managing your license, refer to the License Key Guide.
Step 1: Setting up CI/CD Pipelines with Specmatic
Please go through the detailed Continuous Integration guide to set up Specmatic in your CI/CD pipelines for:
- Central Contract Repo
- API Consumers
- API Providers
Step 2: Configuring Specmatic Insights
Integrating with CI/CD Pipelines
Please add the following 2 steps to your CI/CD pipeline configuration:
Legacy build reporter support has been removed. If your pipeline still uses specmatic-insights-build-reporter-github-action or specmatic-insights-github-build-reporter, migrate to specmatic send-report using the Migration Guide.
- GitHub
- GitLab
- name: Write specmatic license key to file
  run: |
    mkdir -p ~/.specmatic
    echo "${{ secrets.SPECMATIC_LICENSE_KEY }}" > ~/.specmatic/specmatic-license.txt

- name: Publish Build Reports to Specmatic Insights
  if: github.ref == 'refs/heads/main'
  run: |
    docker run --rm \
      -v ~/.specmatic:/root/.specmatic \
      -v ${{ github.workspace }}:/usr/src/app \
      specmatic/enterprise \
      send-report \
      --branch-name ${{ github.ref_name }} \
      --repo-name ${{ github.event.repository.name }} \
      --repo-id ${{ github.repository_id }} \
      --repo-url ${{ github.event.repository.html_url }}
publish_specmatic_insights:
  stage: report
  image:
    name: specmatic/specmatic:latest
    entrypoint: [""]

  rules:
    - if: '$CI_COMMIT_BRANCH == "main"'
      when: on_success
    - when: never

  before_script:
    - mkdir -p ~/.specmatic
    - echo "$SPECMATIC_LICENSE_KEY" > ~/.specmatic/specmatic-license.txt

  script:
    - |
      specmatic send-report \
        --branch-name "$CI_COMMIT_BRANCH" \
        --repo-name "$CI_PROJECT_NAME" \
        --repo-id "$CI_PROJECT_ID" \
        --repo-url "$CI_PROJECT_URL"
This will ensure that only when you merge the changes to your main branch, your build reports are sent to Specmatic Insights after each CI/CD pipeline execution, allowing Specmatic Insights to aggregate and visualize your API ecosystem effectively.
Step 3: Visualizing Your API Ecosystem
Viewing Your Service Mesh
Once your CI/CD pipelines are set up and executed, you should be able to view your service mesh on the Specmatic Insights dashboard:
- Log in to your Specmatic Insights account.
- After successful login, you will automatically land on the main dashboard.
- Now, you should see a visualization of your services and their dependencies.
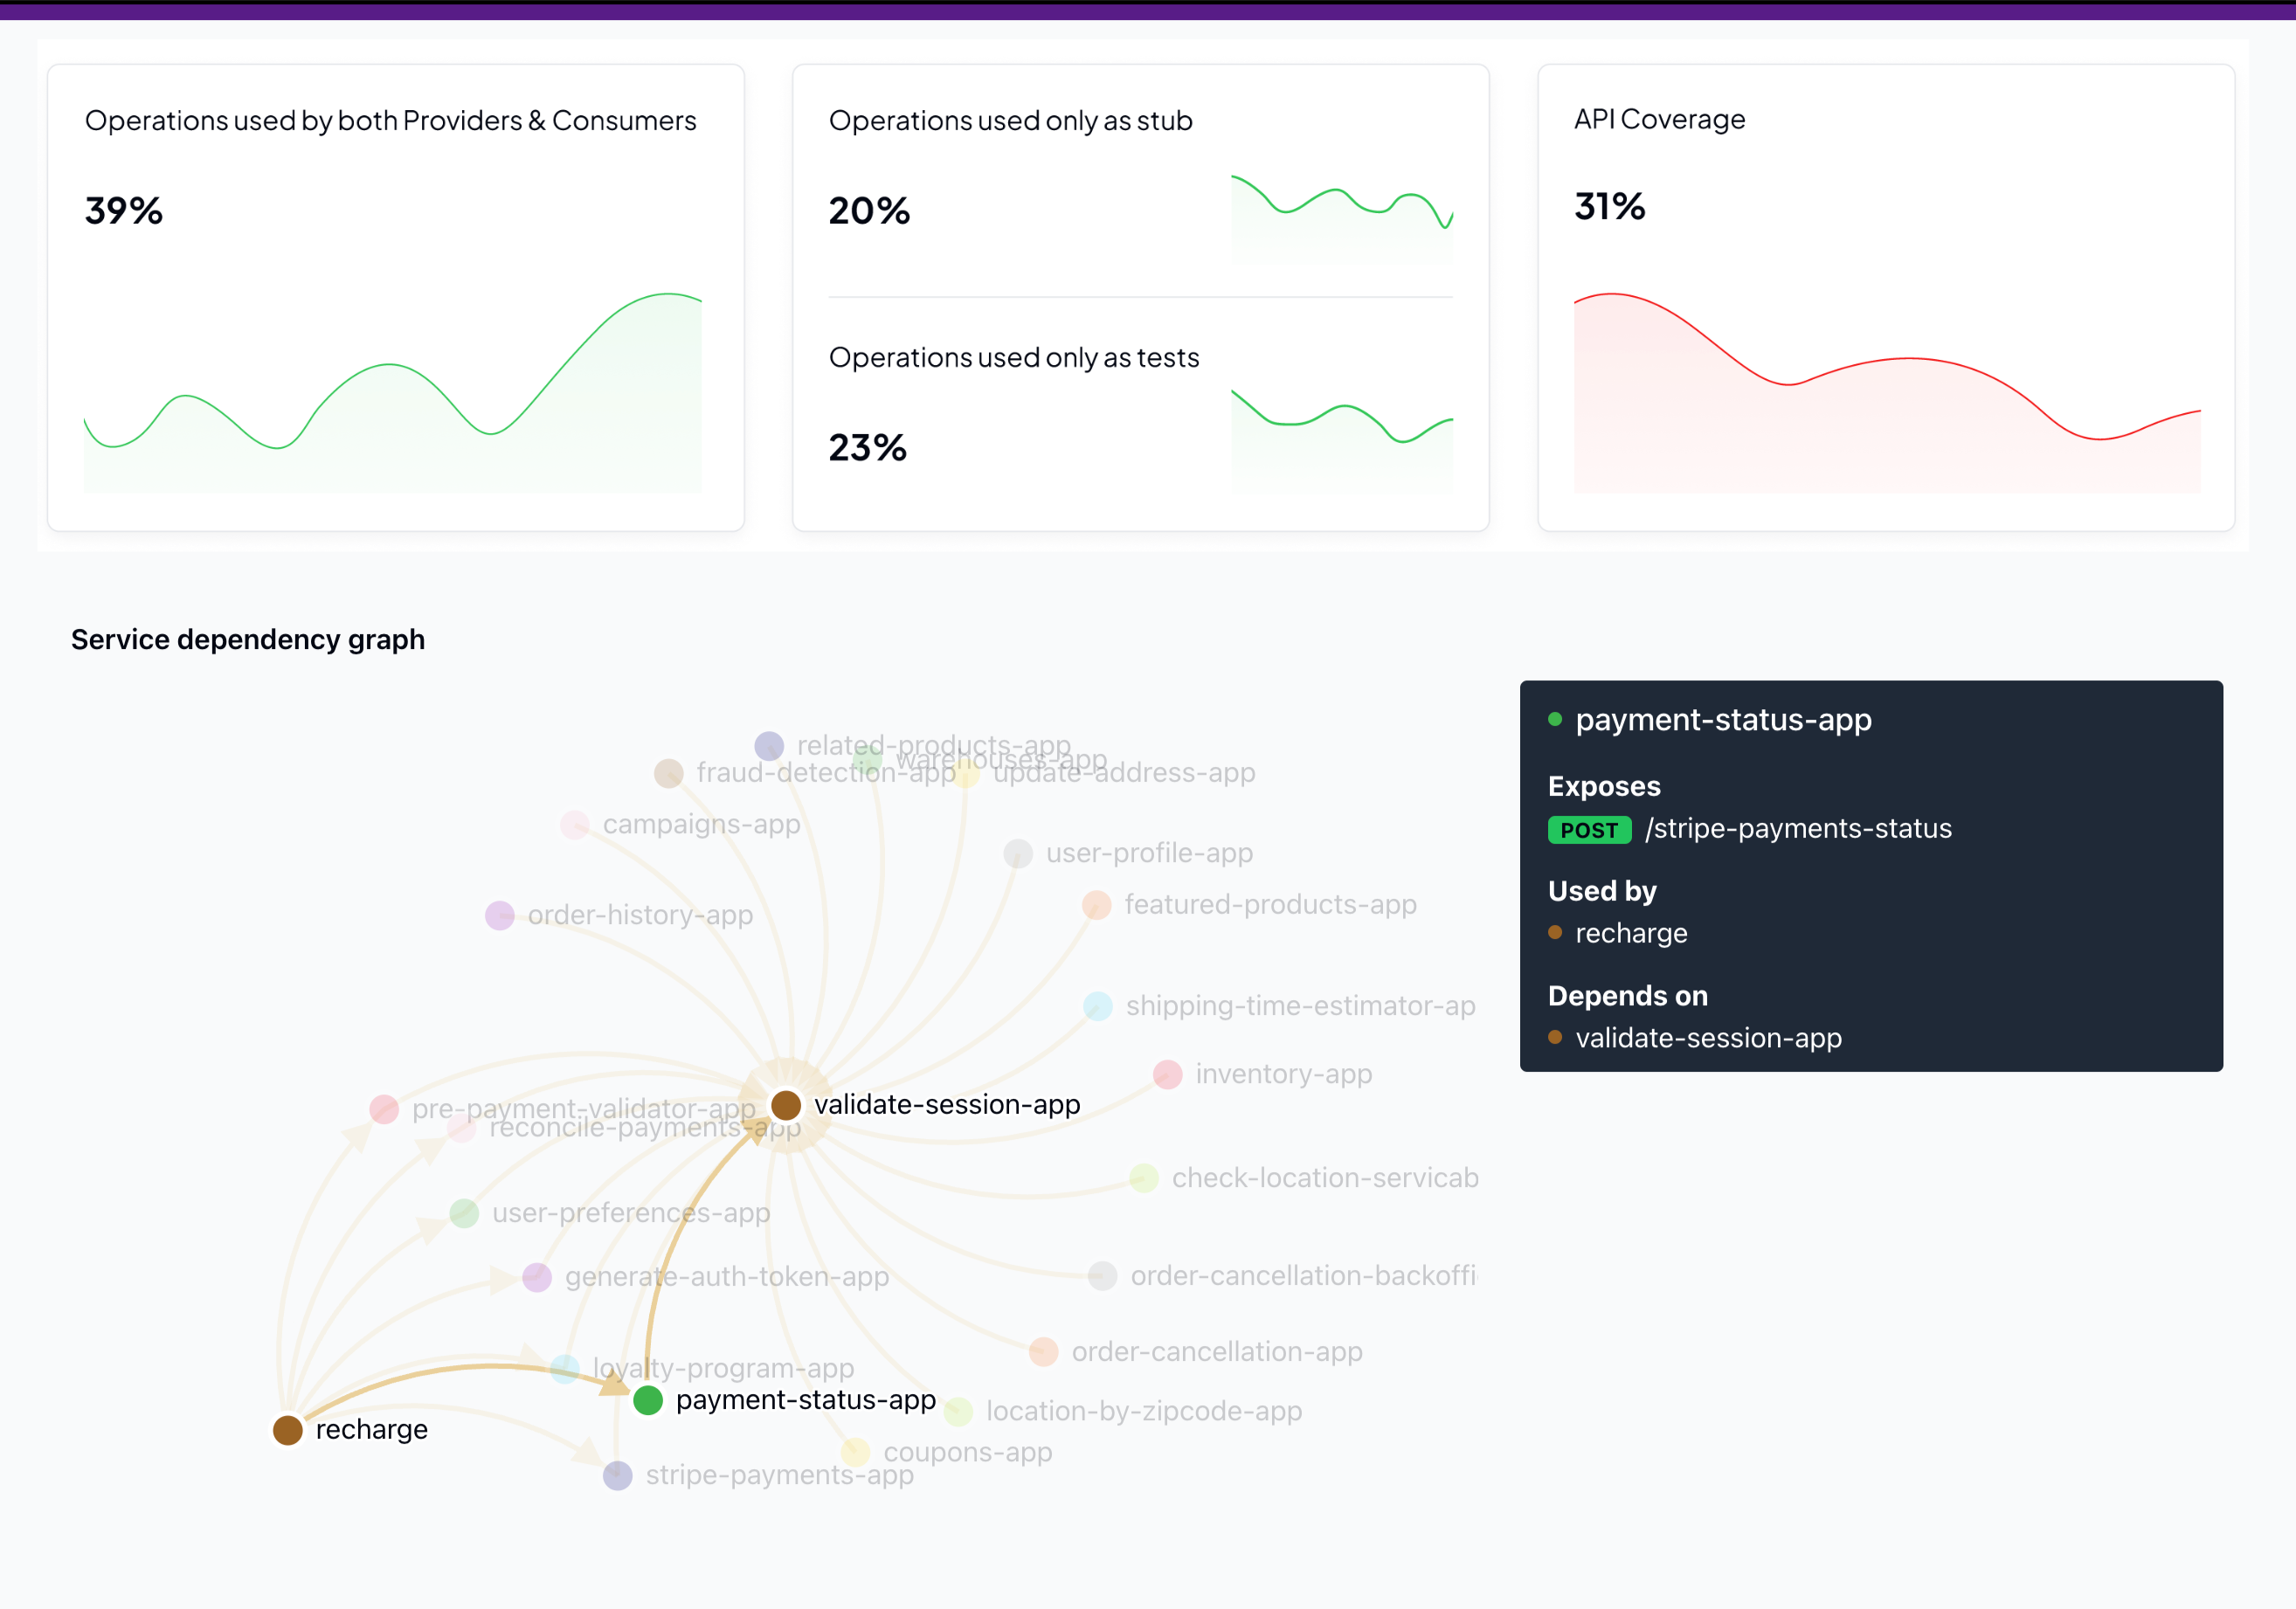
For example, if you've been following the Order example, your service mesh might look like this:
Understanding the Dashboard
The Specmatic Insights dashboard provides several key pieces of information:
- Service Dependency Graph: Shows how your services are interconnected.
- API Coverage: Indicates how much of your API is covered by tests and contracts.
- Operations Usage: Breaks down operations used by both providers and consumers, as tests only, and as stubs only.
For a detailed explanation of the stats summary cards and how the percentages are calculated, see Insights Stats Overview.
Here's an example of what you might see if you have followed the instructions and have been able to set up insights
Next Steps
Congratulations! You've set up a powerful system for managing and visualizing your APIs. Here are some next steps to consider:
- Integrate more of your services into this ecosystem.
- Use the insights gained to identify areas for improvement in your API design and usage.
- Leverage Specmatic for contract-driven API development.
Working with proxies
If you're working behind a corporate firewall or proxy, you may need to configure proxy settings for Specmatic tools to access external resources. Here are the common configurations:
For Docker deployments:
docker run \
  -e JAVA_OPTS='-Dhttp.proxyHost=your-proxy-host -Dhttp.proxyPort=3128 -Dhttps.proxyHost=your-proxy-host -Dhttps.proxyPort=3128' \
  specmatic/specmatic
For JAR files:
java \
  -Dhttp.proxyHost=your-proxy-host \
  -Dhttp.proxyPort=3128 \
  -Dhttps.proxyHost=your-proxy-host \
  -Dhttps.proxyPort=3128 \
  -jar specmatic.jar
For specmatic NPM package
export JAVA_OPTS='-Dhttp.proxyHost=your-proxy-host -Dhttp.proxyPort=3128 -Dhttps.proxyHost=your-proxy-host -Dhttps.proxyPort=3128'
npx specmatic
Replace your-proxy-host with your actual proxy server address and 3128 with the appropriate port number. Contact your IT administrator for the correct proxy configuration details if you're unsure.
Note: Specmatic does not support NTLM (NT LAN Manager) authentication for proxies. If your corporate environment uses NTLM proxies, you'll need to set up an intermediary proxy server (such as CNTLM or Px) that can handle NTLM authentication and provide basic/digest authentication or no authentication to Specmatic.
Troubleshooting
Tip: If you encounter issues, check the following common problems:
- License Key Invalid or Missing: Ensure your license key is correctly configured and not expired. Refer to the License Key Guide.
- Build Report Not Visible: Confirm that your CI pipeline is publishing reports to the correct Insights endpoint and that network access is not blocked.
- Specmatic Docker Image Issues: Make sure you are using the latest Specmatic Docker image and that your environment has Docker installed and running.
- API Spec Errors: Validate your OpenAPI specifications for syntax and compatibility before running the pipeline.
- Dashboard Not Showing Services:
- Ensure your CI/CD pipelines are correctly set up with the Specmatic Insights Build Reporter.
- Verify that your Specmatic reports are being generated in the specified directory (e.g.,
./build/reports/specmatic).
For additional help, consult the Specmatic documentation or contact Specmatic support.