Insights Stats Overview
This page explains the summary cards at the top of the Insights stats page and how to interpret them.
The first four cards are contract stats. They are calculated against the latest central contract repository snapshot and are shown as a rolling 3-month view aggregated week by week.
In other words:
- the central repo provides the contract baseline
- service builds are interpreted against that baseline
- the trend lines on these cards represent weekly points across the last 12 weeks
The Specmatic Usage card is separate. It shows overall Specmatic feature invocations for the selected time period.
How Insights Understands Builds
Specmatic Insights accepts two kinds of builds:
Central Repo BuildsService Builds
These two build types serve different purposes.
Central Repo Builds
A central repo build describes the contract surface of your organization.
It contains:
- the set of specifications present in the central contract repository
- metadata for each specification, such as path, method, response code, etc. for OpenAPI specs
- the set of operations defined in each specification
When Insights receives a central repo build, it stores it as:
- a build
- containing a set of specs
- where each spec contains a set of operations
This becomes the reference contract snapshot against which service builds are interpreted.
Service Builds
A service build describes how a particular service is interacting with those specifications.
Like a central repo build, a service build also contains a set of specs. However, for each spec in a service build, Insights also records how that service is using the spec.
A spec in a service build is classified as one of the following:
tested, in which case it contains tested operations (provider-side contract verification)mocked, in which case it contains mocked operations (consumer-side mock usage)
What Is An Operation?
The meaning of an operation depends on the type of specification.
Insights identifies operations differently for each protocol so that the same logical contract interaction is counted consistently across central repo builds and service builds.
OpenAPI
For an OpenAPI specification, an operation is identified by the combination of:
PathMethodRequest Content TypeResponse Code
For example:
GET /orders -> 200POST /orders (application/json) -> 201
These are treated as two distinct operations.
AsyncAPI
For an AsyncAPI specification, an operation is identified by the combination of:
Operation NameChannel NameAction
For example:
placeOrderon channelnew-orderswith actionreceiveplaceOrderon channelwip-orderswith actionsend
These are treated as separate operations.
GraphQL
For a GraphQL specification, an operation is identified by the combination of:
Operation TypeOperation Name
For example:
query getOrdersmutation saveOrder
These are treated as distinct operations.
gRPC
For a gRPC specification, an operation is identified by the combination of:
Package NameService NameRPC Name
For example:
- package
com.orders, serviceOrderService, RPCGetOrder - package
com.orders, serviceOrderService, RPCSaveOrder
These are treated as separate operations.
Why This Matters
All contract stats in Insights are ultimately based on these operations.
For example:
- contract test coverage measures how many unique central repo operations are currently covered by provider tests
- consumer usage measures how many unique central repo operations are currently used through mocks
- provider-only and consumer-only metrics compare those operation sets
What These Numbers Mean
The four contract-related cards are all calculated against the latest central contract snapshot.
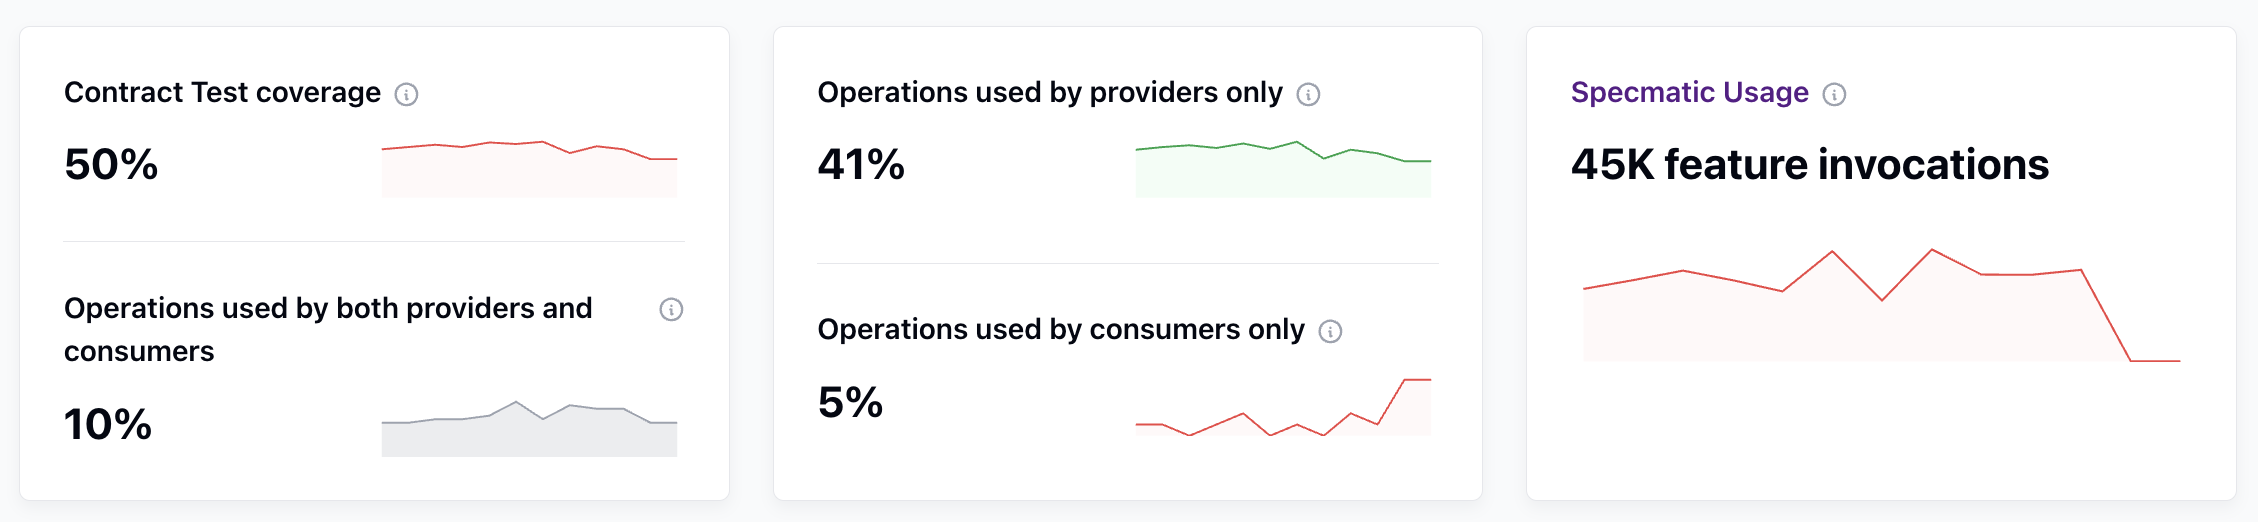
Contract Test coverage
This shows how many unique contract operations are currently validated by provider-side contract tests, expressed as a percentage of all operations in the central contract repository.
For example, if the central contract repository currently contains 6 operations and provider builds cover 3 of them, the card shows 50%.
Operations used by both providers and consumers
This shows the percentage of unique contract operations that are:
- validated by provider-side contract tests, and
- used by consumers through mocks
This is the overlap between provider coverage and consumer usage.
Operations used by providers only
This shows the percentage of unique contract operations that are covered by providers, but are not currently used by any consumers.
This is useful for identifying operations that are tested by providers but are not yet exercised by consumers in their mocking workflows.
Operations used by consumers only
This shows the percentage of unique contract operations that are used by consumers through mocks, but are not validated by any provider contract tests. This is useful for identifying consumer dependencies that are not yet backed by provider-side verification.
Specmatic Usage
This card is separate from the contract stats above.
It shows the total number of Specmatic feature invocations across the last 3 months.
Its trend line is built from weekly totals across the same 3-month period.
For more on Specmatic telemetry and feature usage reporting, see Telemetry Configuration.
Example
Assume the central contract repository contains these 3 OpenAPI specs:
order_service.yaml/orders|GET|200/orders|POST|application/json|201
payment_service.yaml/payments|GET|200/payments|POST|application/json|201
product_service.yaml/products|GET|200/products|POST|application/json|201
Now consider three services:
Order Service- tests
order_service.yaml/orders|GET|200/orders|POST|application/json|201
- mocks
product_service.yaml/products|GET|200
- tests
Payment Service- tests
payment_service.yaml/payments|GET|200/payments|POST|application/json|201
- mocks
product_service.yaml/products|POST|application/json|201
- tests
Product Service- tests
product_service.yaml/products|GET|200/products|POST|application/json|201
- tests
At this point:
- provider-covered/tested operations =
6 - consumer-used/mocked operations =
2 - operations used by both providers and consumers =
2/products|GET|200/products|POST|application/json|201
- operations used by providers only =
4/orders|GET|200/orders|POST|application/json|201/payments|GET|200/payments|POST|application/json|201
- operations used by consumers only =
0
So the cards would read:
- Contract Test coverage =
6 / 6 = 100% - Operations used by both providers and consumers =
2 / 6 = 33% - Operations used by providers only =
4 / 6 = 67% - Operations used by consumers only =
0 / 6 = 0%
Understanding The Contract Listing
The contract listing view expands your central contract repository into its folder structure and shows how much of that contract surface is currently covered and used at every level.
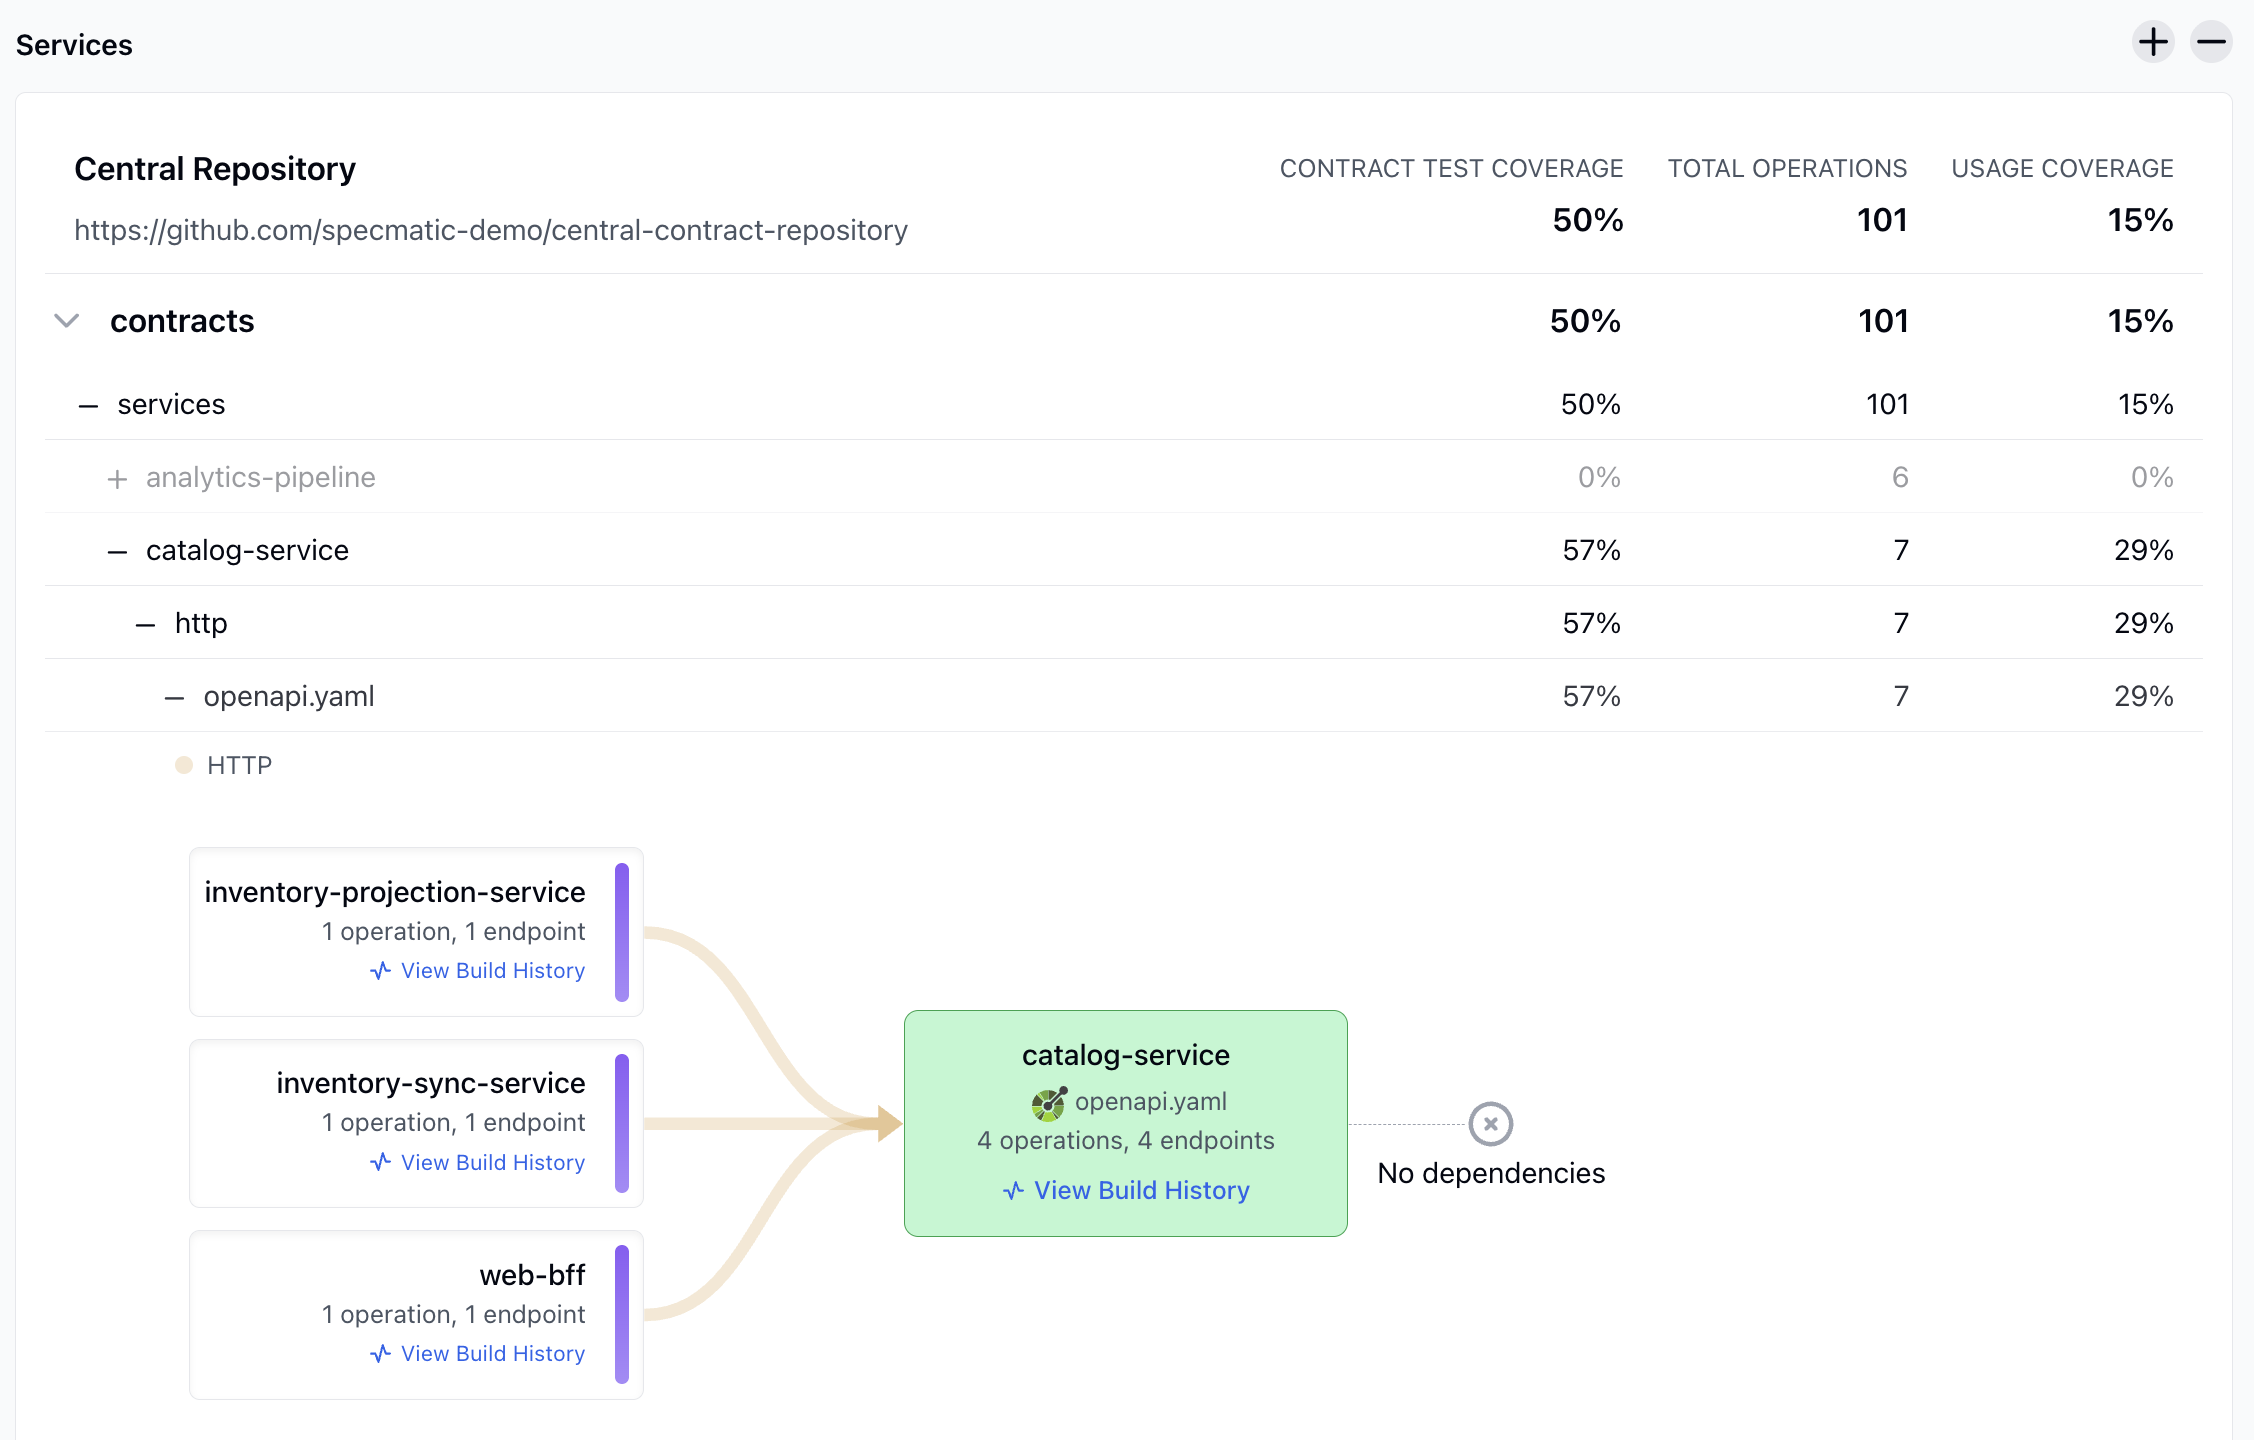
In this view:
Contract Test Coveragemeans the percentage of operations in that repository, folder, or spec that are currently validated by provider-side contract testsTotal Operationsmeans the total number of contract operations in that repository, folder, or specUsage Coveragemeans mock usage, that is, the percentage of operations currently used by consuming services through mocks
The tree is built from the contract repository structure:
- central repository
- folders
- sub-folders
- individual spec files
Each row in the tree shows three key values:
Contract Test CoverageTotal OperationsUsage Coverage
As you expand the tree:
- each folder shows aggregated contract test coverage for all specs beneath it
- each folder shows aggregated mock usage for all specs beneath it
- each spec file shows the exact values for that specification
Below the tree, Insights also shows the services that implement the selected spec, along with their consumers and dependencies.
Contract Test Coverage
This is the percentage of operations in that row that are currently validated by provider-side contract tests.
At the spec-file level:
Contract Test Coverage = tested operations / total operations in that spec
At folder and repository levels:
- tested operations are summed across the specs inside that subtree
- total operations are summed across the same subtree
- the percentage is then calculated from those totals
Total Operations
This is the total number of contract operations present in that row.
For a spec file, this is simply the number of operations defined in that specification.
For a folder or repository node, this is the sum of all operations contained in the specs below that node.
Usage Coverage
This is the percentage of operations in that row that are currently mocked by consumers.
At the spec-file level:
Usage Coverage = mocked operations / total operations in that spec
At folder and repository levels:
- mocked operations are summed across the specs inside that subtree
- total operations are summed across the same subtree
- the percentage is then calculated from those totals
Contract Listing Example
Suppose a spec file openapi.yaml contains 7 operations.
If providers are testing 4 of those operations and consumers are mocking 2 of them, the row for that spec would show:
- Contract Test Coverage =
4 / 7 = 57% - Total Operations =
7 - Usage Coverage =
2 / 7 = 29%
If that spec sits under a folder called catalog-service, and there are no other spec files in that folder, the catalog-service folder will show the same values:
- Contract Test Coverage =
57% - Total Operations =
7 - Usage Coverage =
29%
If a parent folder contains multiple specs, the folder-level values are calculated by aggregating all operations and all covered or mocked operations beneath that folder.
In the service panel below the tree, Insights then shows:
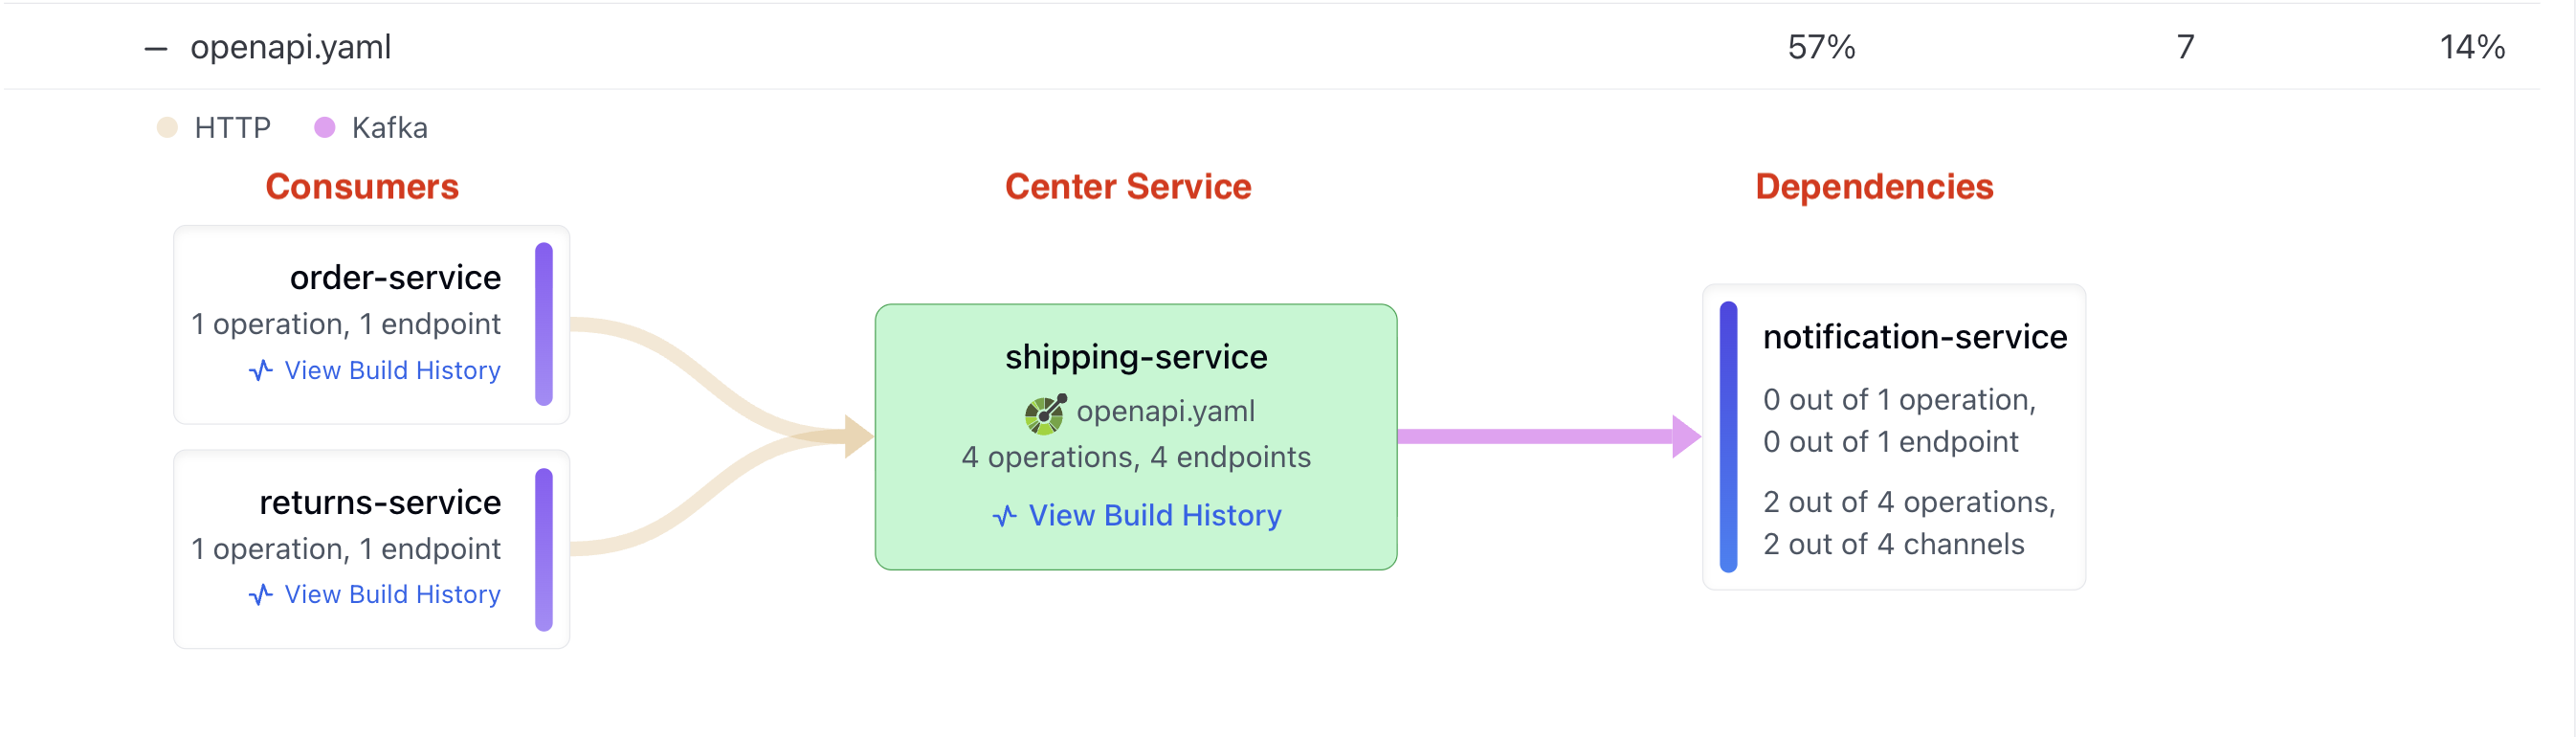
Center Service: the provider service that implements the selected specificationLHS Services: the consumer services that mock the selected specificationRHS Services: the downstream dependencies of the center service
This panel helps you understand a spec from three perspectives at once:
- who provides it
- which services consume it through mocks
- what other services the provider itself depends on
This lets you move from contract-level reporting to service-level relationships without leaving the same view.